Method
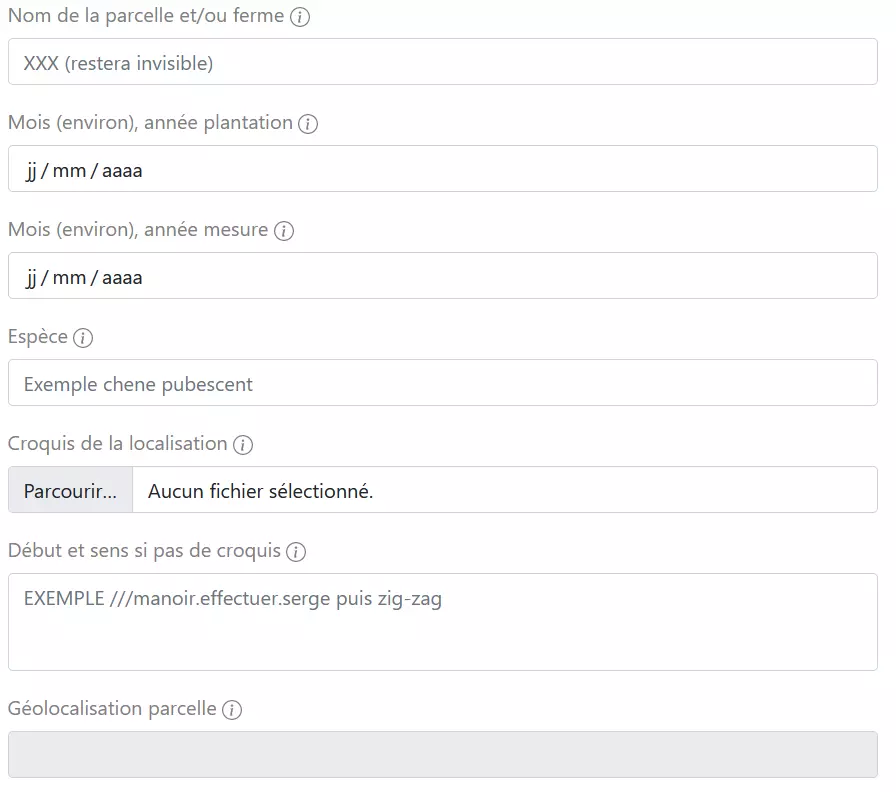
Fill in
Minimum and maximum for a species
-
Minimum: <10 trees and 2 dates: planting/measure1 or measure1/measure2,
-
Maximum: >= 10 trees and 3 dates: planting/measurement1/measurement2.
Why measure only twice?
Two diameter measurements are enough to calculate the average annual increment slope. To get the best estimate of the slope of annual growth, the trees must be well out of the start-up crisis. A good year's growth after a period of poor growth is an indicator.
The greater the difference between the two measurements, the better the estimate of annual growth will be, because it incorporates several growing seasons. I count on a minimum gap of 3 years. If I measure again, I'll get new, more reliable results because more growing seasons will have been taken into account.
Info
An online application, Adonis, can be used to measure a large number of trees, but without automatic results.
Sharing
-
The rough GPS location is enough to give an idea of the local climate.
-
I indicate the commune of the plot or a nearby commune, I choose whether the commune or the département will be indicated in the table of collective results.
-
The mean and the variation around it (= standard deviation) will be shared if I agree.
-
The form number is unique and known only to me and the administrator.
Personal space
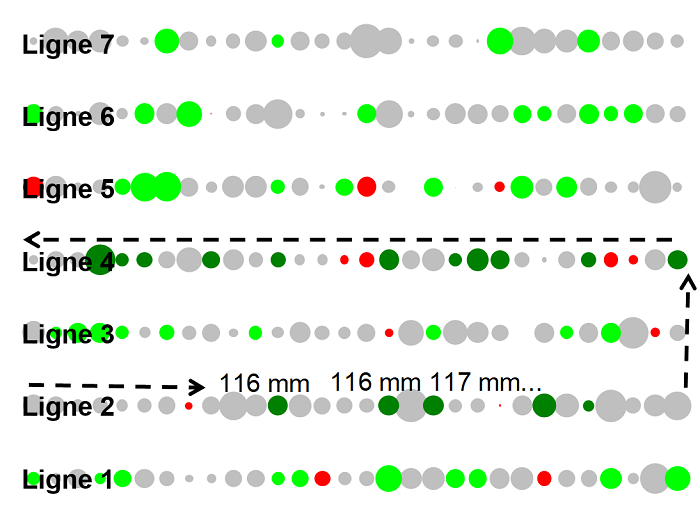
A code, text and colour indicate the status of the forms, arranged in order of creation date in the personal area:
-
Light grey 1/1 Status: waiting for confirmation - action 1: saved data can be modified
-
Ligth green 2/1 Status: completed - action 1: data has been confirmed, "Download" appears
-
Dark grey 1/2 Status: awaiting confirmation - action 2: saved data can be modified
-
Dark green 2/2 Status: completed - action 2: data has been confirmed, "Download" appears
Info
The name given at the start should make it easy to find later!
Locating trees
With tags
How to get these tags for free
-
After registering, I receive an e-mail with instructions to follow: I indicate the number of tags I need.
-
I will also receive laces and a measuring tape.
-
A forestry label placed on the trunk and held in place by an elastic lace will last for several years.
With plan
I don't want to or can't put up labels.
-
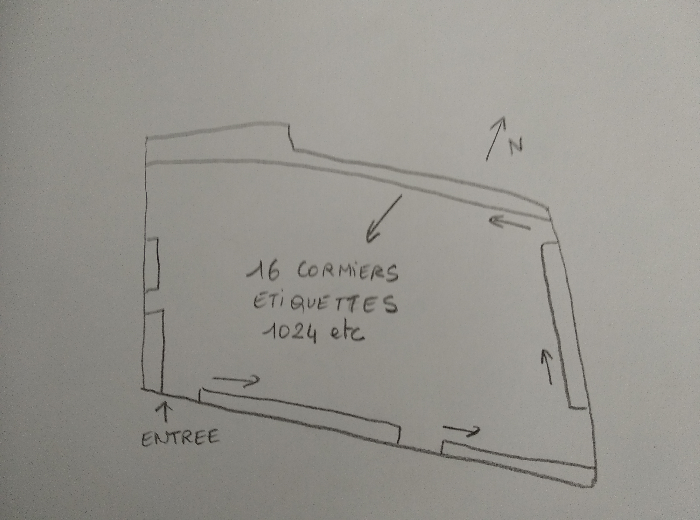
Either I already have a tree-by-tree plan, or I prefer to draw one and take a photo of it.
-
It will appear as figure 1 in the automatic return.
-
In both cases, I remember to number the measured trees in sequence.
-
The DIAFnostic smartphone application can be used to produce a map based on the GPS data collected at the foot of each tree.
-
This map appears in the automatic feedback, in figure 2.
No label or plan
-
The first time I measure a sample of 15 trees for a species, for example, without noting or labelling anything.
-
A few years later, I measure a new sample of 15 trees, some of which may be the same.
The variation ("standard deviation") around the mean in diameter gain per year cannot be calculated.
The diameter estimate 10, 20, 30 years later, for each tree in sample 2, will be based on the average, and not on the exact increase between measurement 1 and measurement 2.
It will therefore be more approximate.
Decide
Choosing the species
Choose a species that grows well and therefore seems well adapted to current soil and climate conditions.
The pre-registered list is intended to be very extensive, and I can write down what I want by choosing "Other".
I can add the variety as a comment. For grafted fruit trees, I can also note the rootstock in the comments.
If I want to estimate the growth of a hedge for its value for wood energy, made up of a mixture of single and multi-stem species, between two dates, I choose "Other" as the species, and write "Mixed_hedge". The choice of stems to be measured must be particularly precise, to ensure that they are representative.
The future growth estimated in the automatic feedback is meaningless, since growth is constrained by the neighbours (competition).
Choosing the number of trees
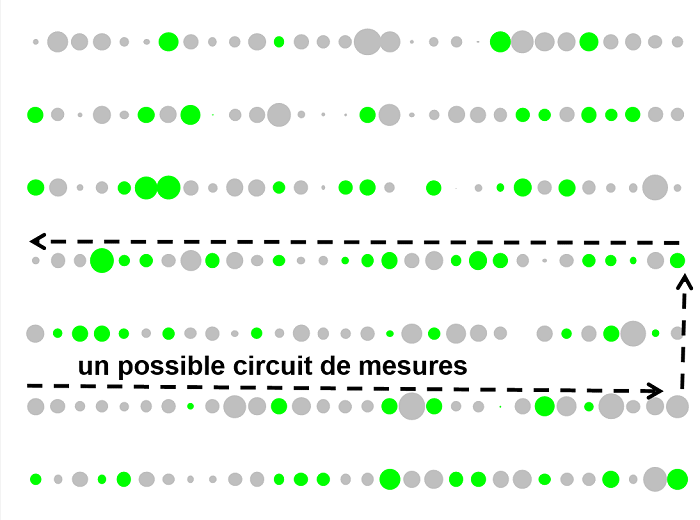
A sample of measured trees should contain a minimum of 10 and a maximum of 30 (e.g. 16 trees in dark green lines 2 and 4). This sample will be used to estimate the volume of timber that can be harvested from the entire plot. The trees in this sample must be of the same age, give or take one or two years, and representative of the whole area to be estimated.
If I wish, I can measure all the trees present (>30, e.g. all the trees in green lines 1 to 7).
On the other hand, if I have less than 10 trees per species (e.g. 5 trees in dark green line 2), we can only estimate the fate of these particular trees but not extrapolate the results to other trees.
Recording on your smartphone
With the DIAFnostic smartphone application, I can take measurements directly on the plot.
Note down on paper
After printing out the blank form, I record the measurements by hand in the field and then transfer them to the online form.
Sampling
10 to 30 unbiased trees
If I go through the whole plot, I can take the opportunity to sample everything (if possible up to 30 trees, as this will be more representative!). The time taken to measure and apply the tag is very low compared with the time it takes to walk around the plot.
The risk of inadvertently selecting the largest trees is very likely, but this would result in an overestimate. To avoid this bias, I can decide, for example, to measure only one tree in three (correct) or all the trees (correct) on sections of line.
If I'm not familiar with the plot, I'll measure one (portion of) line on the way out, and another (portion of) line on the way back.
Different areas of a plot
Two areas of a plot can be very different.
To get good, distinct estimates, I treat them with two samples or choose just one zone (for example, a zone with no standing water).
In this case, I know that the results will only apply to this zone.
If there is a continuous gradient of fertility along a slope, for example, I sample along the gradient.
Describe your career
I can add comments or save a photo or scan in the form.
The text or photo will appear in the automatic feedback.
examples
Examples of comments: "hedge to the right of the entrance", "all hedges, start south, clockwise". Examples of photos or scans: a hand-drawn diagram or a printed plan with arrows added by hand.
Taking precautions
Do not measure certain trees
Exclusions
-
I exclude accidental trees: too puny (visible or probable accident, special planting condition), too twisted, broken or forked within the first three metres.
-
I also exclude trees with several main stems, as the measurement of one stem will not be representative of the trunks of the species in the plot.
-
In the particular case of trees planted about 1 m apart, one of which is due to be thinned, I choose the one that will be kept.
The right thing to do
the right gestures
Conventionally, I measure at chest height = 1.30 m. But it is sometimes necessary to adapt when there is protection, so I choose to measure above it or under the branches if there are any.
I place the tape measure horizontally around a section of trunk free of branches or wounds and then read the number of mm of circumference next to the 0 mark.
The time
To measure 10 to 15 trees correctly and label them, I allow about a quarter of an hour. The longest part is walking the lines or hedges.
Limits of use
The model is based on trees without lateral competition growing linearly after the start-up phase.
The calculations are not suitable in the following cases:
- If a tree is not cut, its growth will plateau (but when?).
- For certain species or varieties with particular growth characteristics: hybrid paulownias, hybrid poplars, etc.
- If the species is not adapted to the soil and climate conditions, growth will be weak or stop before the exploitable size is reached.
- If the future of the target species is not favourable. Climate change is already affecting the future of forest species.
- Where there is a risk of unpredictable severe hazards. The frequency of extreme events is increasing and this could wipe out a plantation.


