Results
Shared results table
Averages and deviations from the average appear automatically when the user has reported the data as true and accepted sharing, and if the number of trees measured is at least 10.
It does not contain any personal data or individual tree data.
Deleting a form in a personal space will delete the corresponding line from the table. It can be exported using the "CSV" button, and will not include the content of public comments, which are only visible online.
Would you like to share the averages, but not your data on an exceptional tree, or have you made a mistake regarding the content of a public comment? See below: it's easy to change the content and produce a new result.
Note
The data is only accessible to the DIAFnostic administrator: INRAE UMR BioForA. Details of the methods: frederique.santi@inrae.fr.
| Croissance estimée par arbre | Diamètre mesure 1 (cm) | Diamètre mesure 2 (cm) | Gain/an (cm) | Comm | |||||||||||||||||
|---|---|---|---|---|---|---|---|---|---|---|---|---|---|---|---|---|---|---|---|---|---|
| Tous | Exc | Tous | Exc | Tous | Exc | Tous | Exc | ||||||||||||||
| N° de formulaire | Espèce | Localisation | Age | Nombre d'arbres | Moyenne | Ecart-type | Valeur | NB ET/MOY | Age | Nombre d'arbres | Moyenne | Ecart-type | Valeur | NB ET/MOY | Années | Moyenne | Ecart-type | Valeur | NB ET/MOY | ||
| voir | voir | ||||||||||||||||||||
Legend
-
Age = age at measurement 1, then number of additional years at measurement 2
-
Number of trees = number of trees measured
-
Exc. = Exceptional tree
-
NB ET/MOY = number of standard deviations in addition to the mean
-
Years = number of years taken into account to calculate the annual gain
-
Comm = public comments
Personal results
Get my personal results
-
The "Log in" button opens the scoring and personal results storage area. The first time, I create an account, I choose "Add a measure", then I follow the instructions included in the form.
-
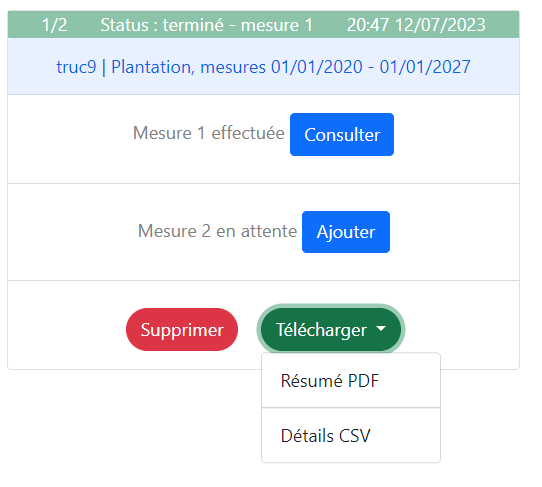
After "Save" at the bottom of the form, a new results pane appears in my space.
-
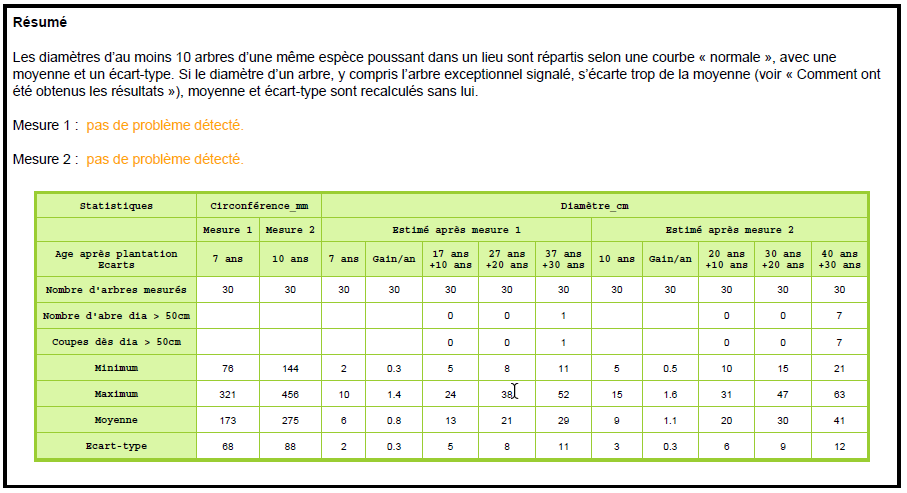
After clicking on the white pane, "Confirm", "Download", I choose "PDF Summary" which includes a summary of what has been filled in, basic statistics, graphs and estimates, for each species.
CSV Format
Choosing "CSV Details" produces the summary and individual values.
This output CSV includes a line 3 with all the parameters entered. It can be used as an input CSV. Change whatever you like, including the Name in the 3rd column. The line can be duplicated several times below: each line is equivalent to a form. Then choose "CSV" to import it.
Info
Recommendation for a first recording: I try "Add a measurement" in test mode to see what the final results look like.
Read the graphs of measured diameters
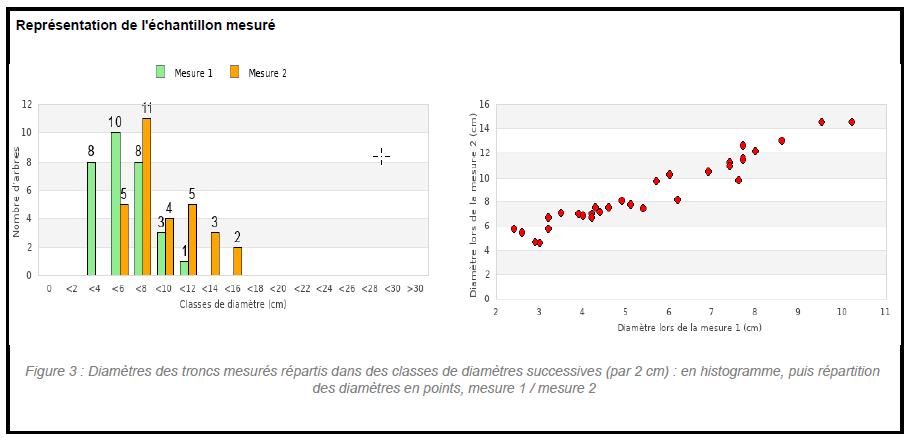
All values are represented. These graphs show whether there are any trees that are significantly different from the others.
If there is only measure 1, the values appear diagonally (as if measure 1 = measure 2).
Graphs of future diameters
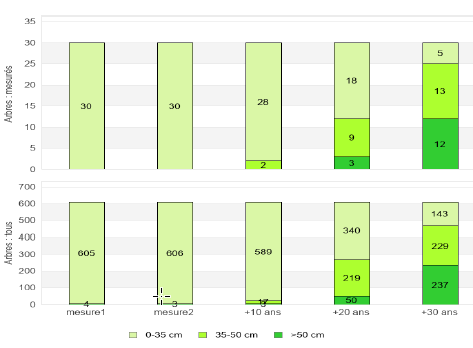
The growth of both measured and simulated trees (if a total number of trees has been written, and there are at least 10 measured trees) is estimated at +10 years, +20 years, +30 years after the measurement.
At the time of the measurement (= year 0 after the measurement), in general all the trees are in the 0-35 cm diameter class.
The number of trunks with diameters greater than 35 cm or 50 cm can be read directly.
Measurement error test
The diameters of a sample of trees of the same species, of the same age, on the same site are expected to follow a "normal" distribution: the values are grouped around an average. When the data is entered via the form, a Shapiro-Wilk test (effective for 10 to 50 values) is performed to detect whether one or two values are too far from the mean. This would probably correspond to a typing error (e.g. read 57 mm, written 577 mm). Small errors are not detectable (e.g. read 57 mm, written 75 mm).
If the test reveals a problem, the most extreme value is removed. The test is repeated and, if necessary, another extreme value is removed. The order of the individual corresponding to an error is indicated in the Summary insert of the PDF Summary.
The means and standard deviations given in the Summary are calculated without these detected individuals.
This test is not performed for CSV imports. In all cases, the best test is to look at Figure 3.
An exceptional tree
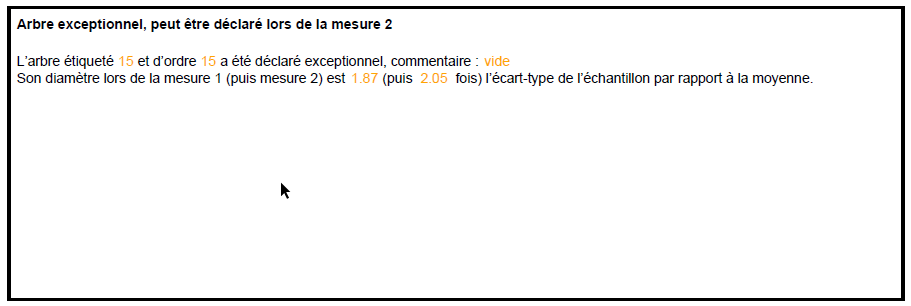
If an exceptional tree has been declared, and 30 measurements have been taken, its deviation from the mean, in number of standard deviations, is noted in the last box of the PDF summary.
If a (horizontal) photo has been supplied, it also appears there.
Can I share my personal results ?
Yes, for example with my advisor, my colleague.
The documents do not contain any personal data, unless I have decided to do so myself.
They may appear in the name given to the form, in "Private comment", or in the location insert.
The rules for sharing are to be decided within groups of people (a chamber of agriculture, an association, etc.).
