Export data
Export order file and plantation
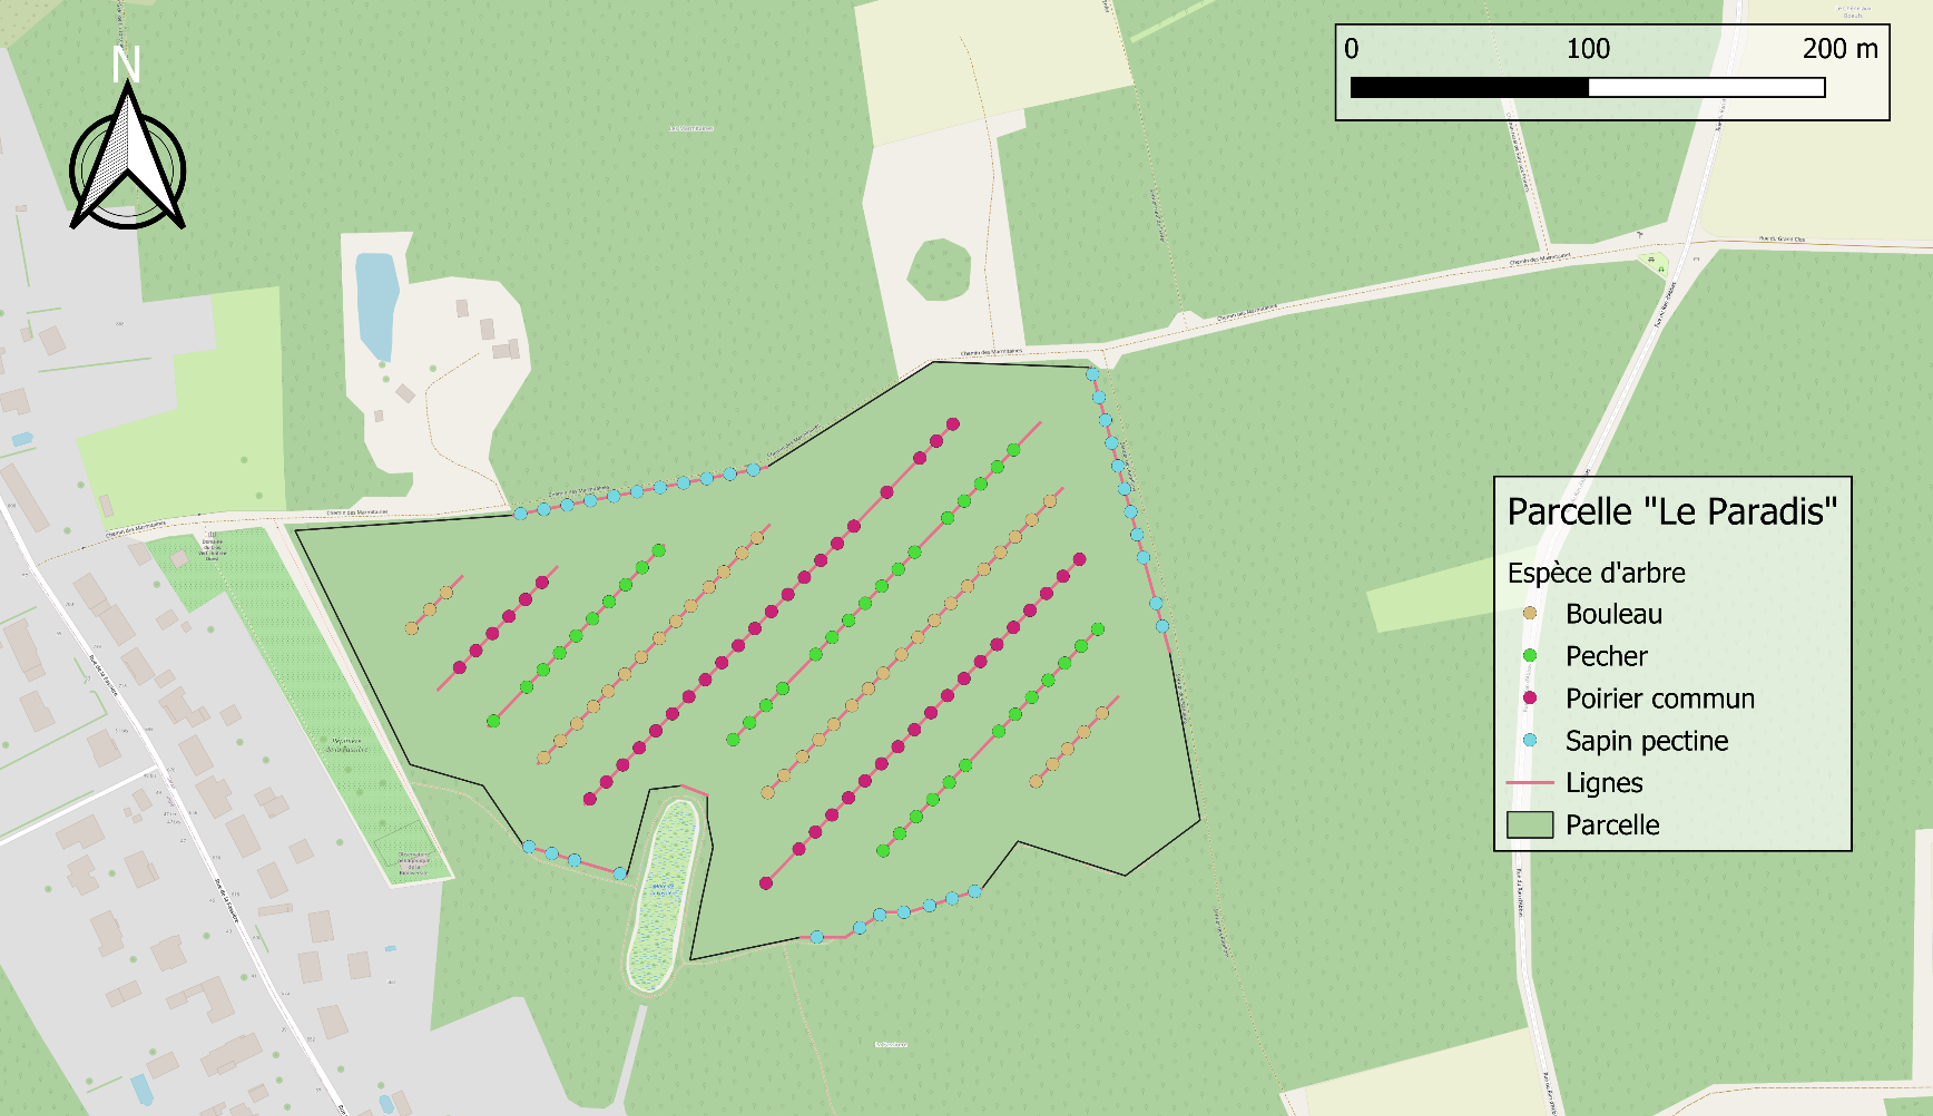
Once you've finished your layout, if it suits you, you can export your plot, tree positions, lines and tree species.
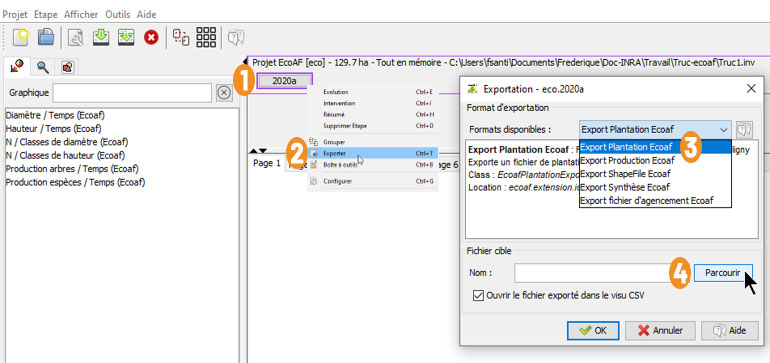
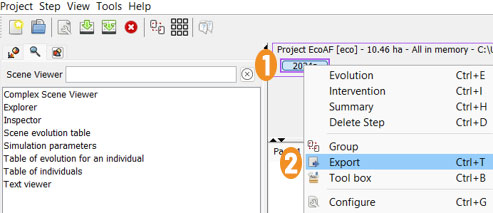
1 Right-click on the year of your choice.
2 Click on Export
3 In the Exportation - ecoXXX window, click in the Available formats field and, in the list, choose Export Plantation Ecoaf
4 Click on the button Parcourir
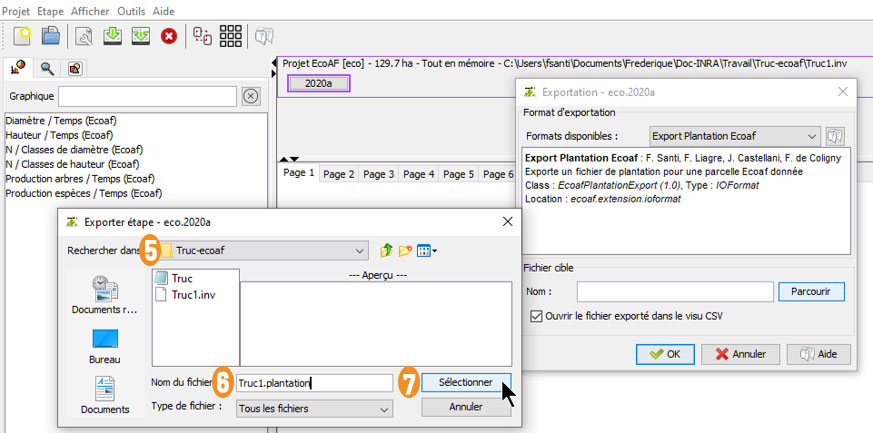
5 In the window Exporter étape - ecoXXX, in the field Rechercher dans, choose your directory.
6 In the field Nom du fichier, give a name with the suffix .plantation
7 Click on the button Sélectionner
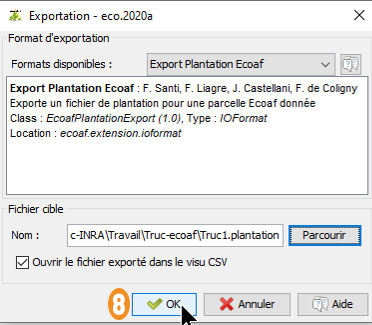
The chosen name is displayed in the in the field Nom.
8 Click on the button OK
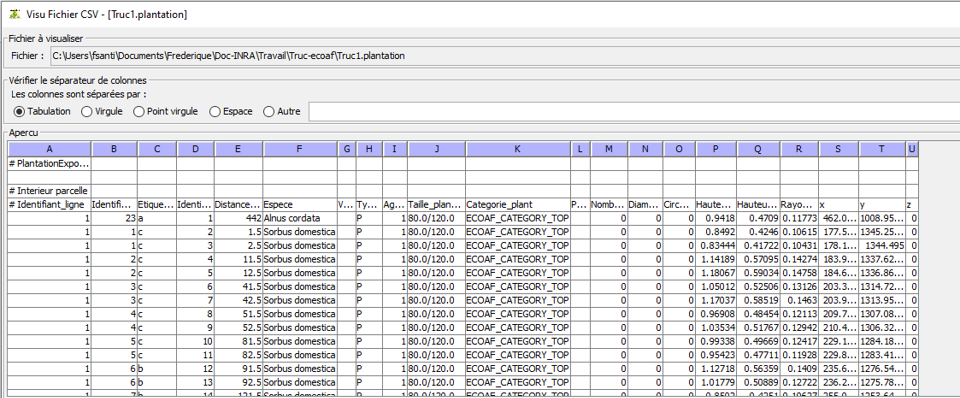
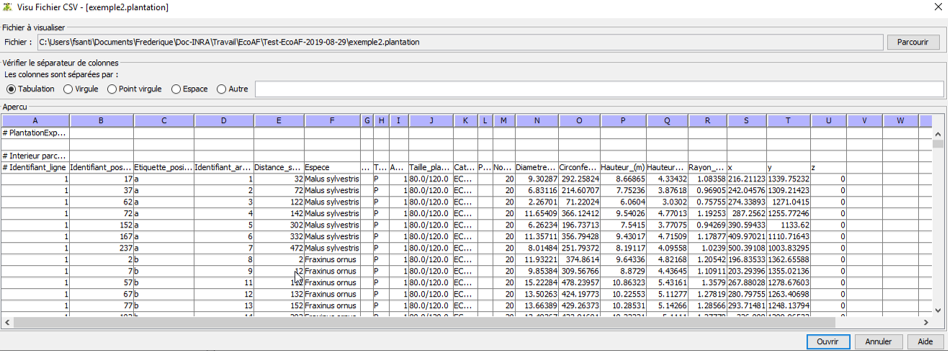
If the "Open export file in CSV view" checkbox is ticked, the file is displayed.
Growth exports
Sort and work as you like in Excel, with all the information in detail.
Exports of fruit production
1 Right-click on the year of your choice
2 Click in the list on Export
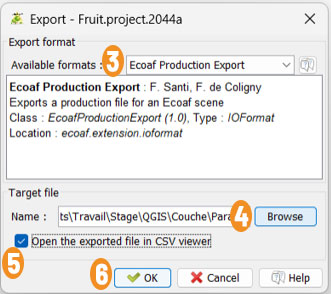
3 In the window Exportation - ecoXXX, click in the field Available format, in the list, choose Ecoaf Production Export
4 Click on the button Browse
5 Tick the box "Open the exported file in CSV viewer"
6 Click on the button OK
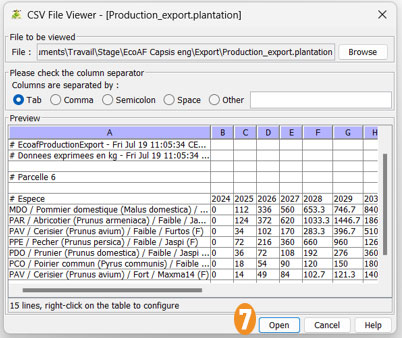
7 In the window CSV File Viewer, click on the button Open pour afficher le tableau avec EcoAF.
Info
You can also open it from Excel, as shown below.
Exit lines and trees
1 Right-click on the year of your choice.
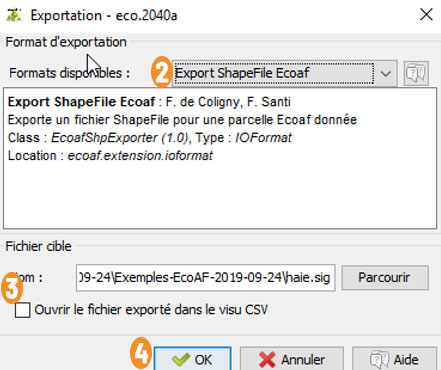
2 In the window Exportation - ecoXXX, click on the field Formats disponibles, in the list, choose Export ShapeFile Ecoaf.
3 Uncheck the "Open export file in CSV view" box, otherwise an error message will appear (these are not tables, so the box is irrelevant).
4 Click on the button OK
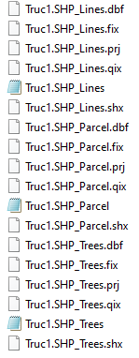
Export Shapefile produces 18 files that can be used with the chosen name.
Add lines and points
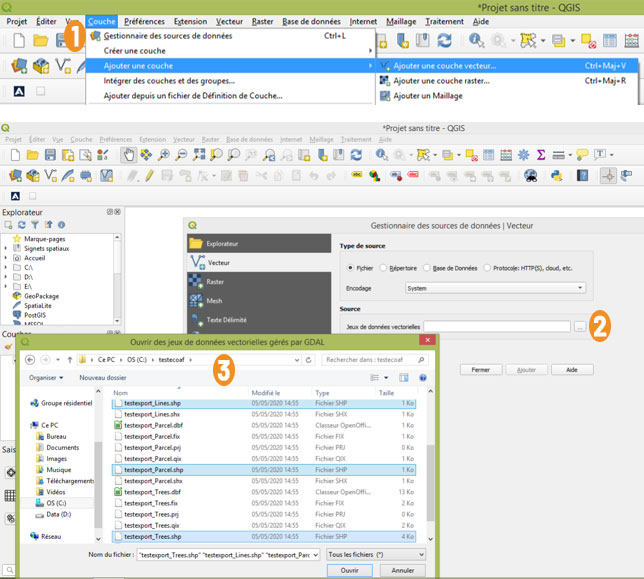
1 In the top menu bar, click on Layer, then in the list on Add a layer and finally Add a vector layer.
2 Next to the Vector data sets field, click on the button with the 3 small dots.
3 In the Open GDAL vector data window, select the .shp files and click on the Open button.
Info
Parcel line and point colours: on export, the colours are random, but you can change them all in QGIS.
Choosing the SCR for your nappies
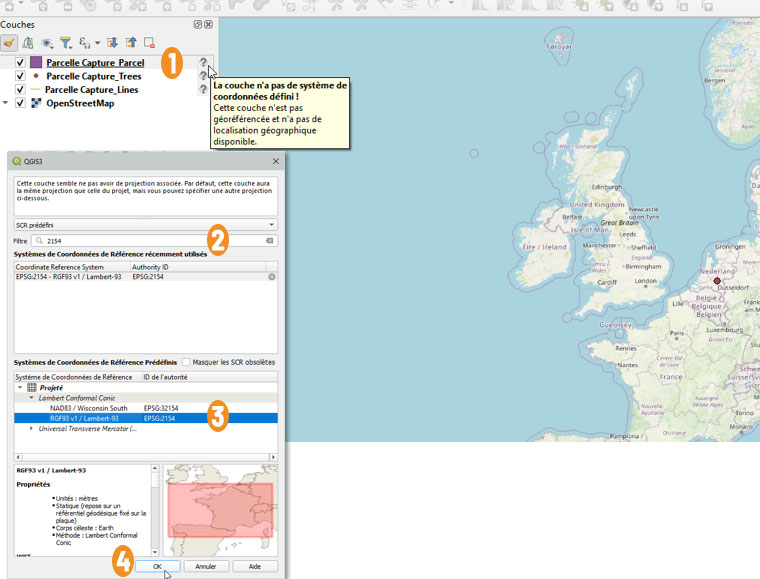
1 In the Layers list, click on the parcel.
2 In the QGIS window, in the Filter field, click on 2154
3 In the Projected list, click on Lambert Conformal Conic and Lambert-93
4 Click on the button OK
Red dot on the map
Your plot appears far from your starting point because the SCR is not defined.
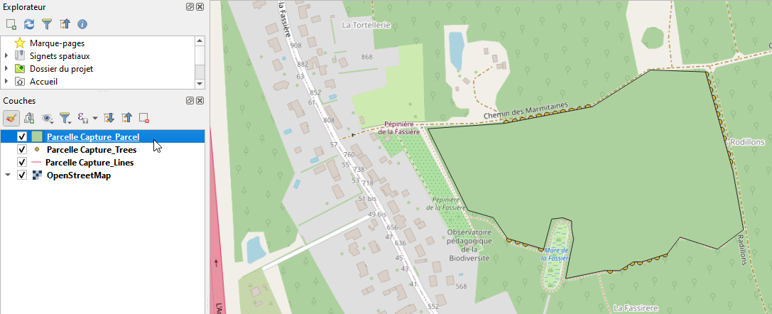
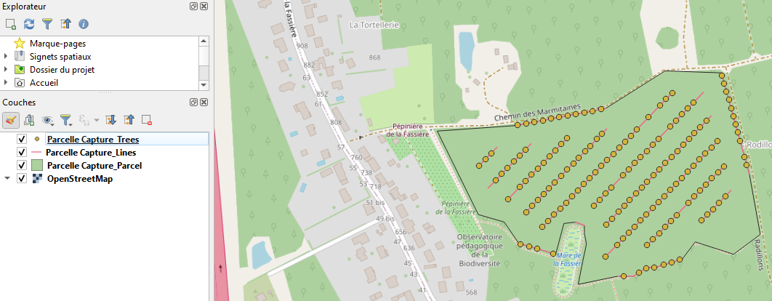
In the window layers, change (if necessary) the order of the layers so that they all appear graphically by dragging them.
For example, in the image above, when Parcelle Capture Parcel is at the top of the list, the points do not appear. And in the image below, Parcelle Capture Trees has been moved to the top of the list, and the points appear..
